No_Tech-Dad Subscribe

6 results · updated 9 Nov 2026

Results

Numbers from the videos, each with the conditions it was measured under. Every claim carries a label; the method explains them.

Handhelds

4 results

Gears of War: E-Day on the OneXPlayer X2

Verdict
Game
Gears of War: E-Day, XeSS Dynamic upscaling
Device
OneXPlayer X2, Intel Arc G3 Extreme
Capture
OBS and CapFrameX on the same device
Where
On a flight, at about 35,000 feet
Unit
Mine
Date
Oct 2026
#WattsPresetVSyncTargetFrame genCPU BoostAvg fps1% low0.2% lowStutter
0130WLowOn60OffOff6239200%
0235WLowOn60OffOff6446240%
0340WLowOn60OffOff6449310%
0440WLowOff90OffOff6548350%
0540WMediumOff90OffOff4945350%
0630WMediumOff90OffOff4638290%
0730WMediumOff902xOff7329210%
0840WMediumOff902xOff7332280%
0940WHighOff903xOff6226220%
1040WHighOff903xOn6227252%

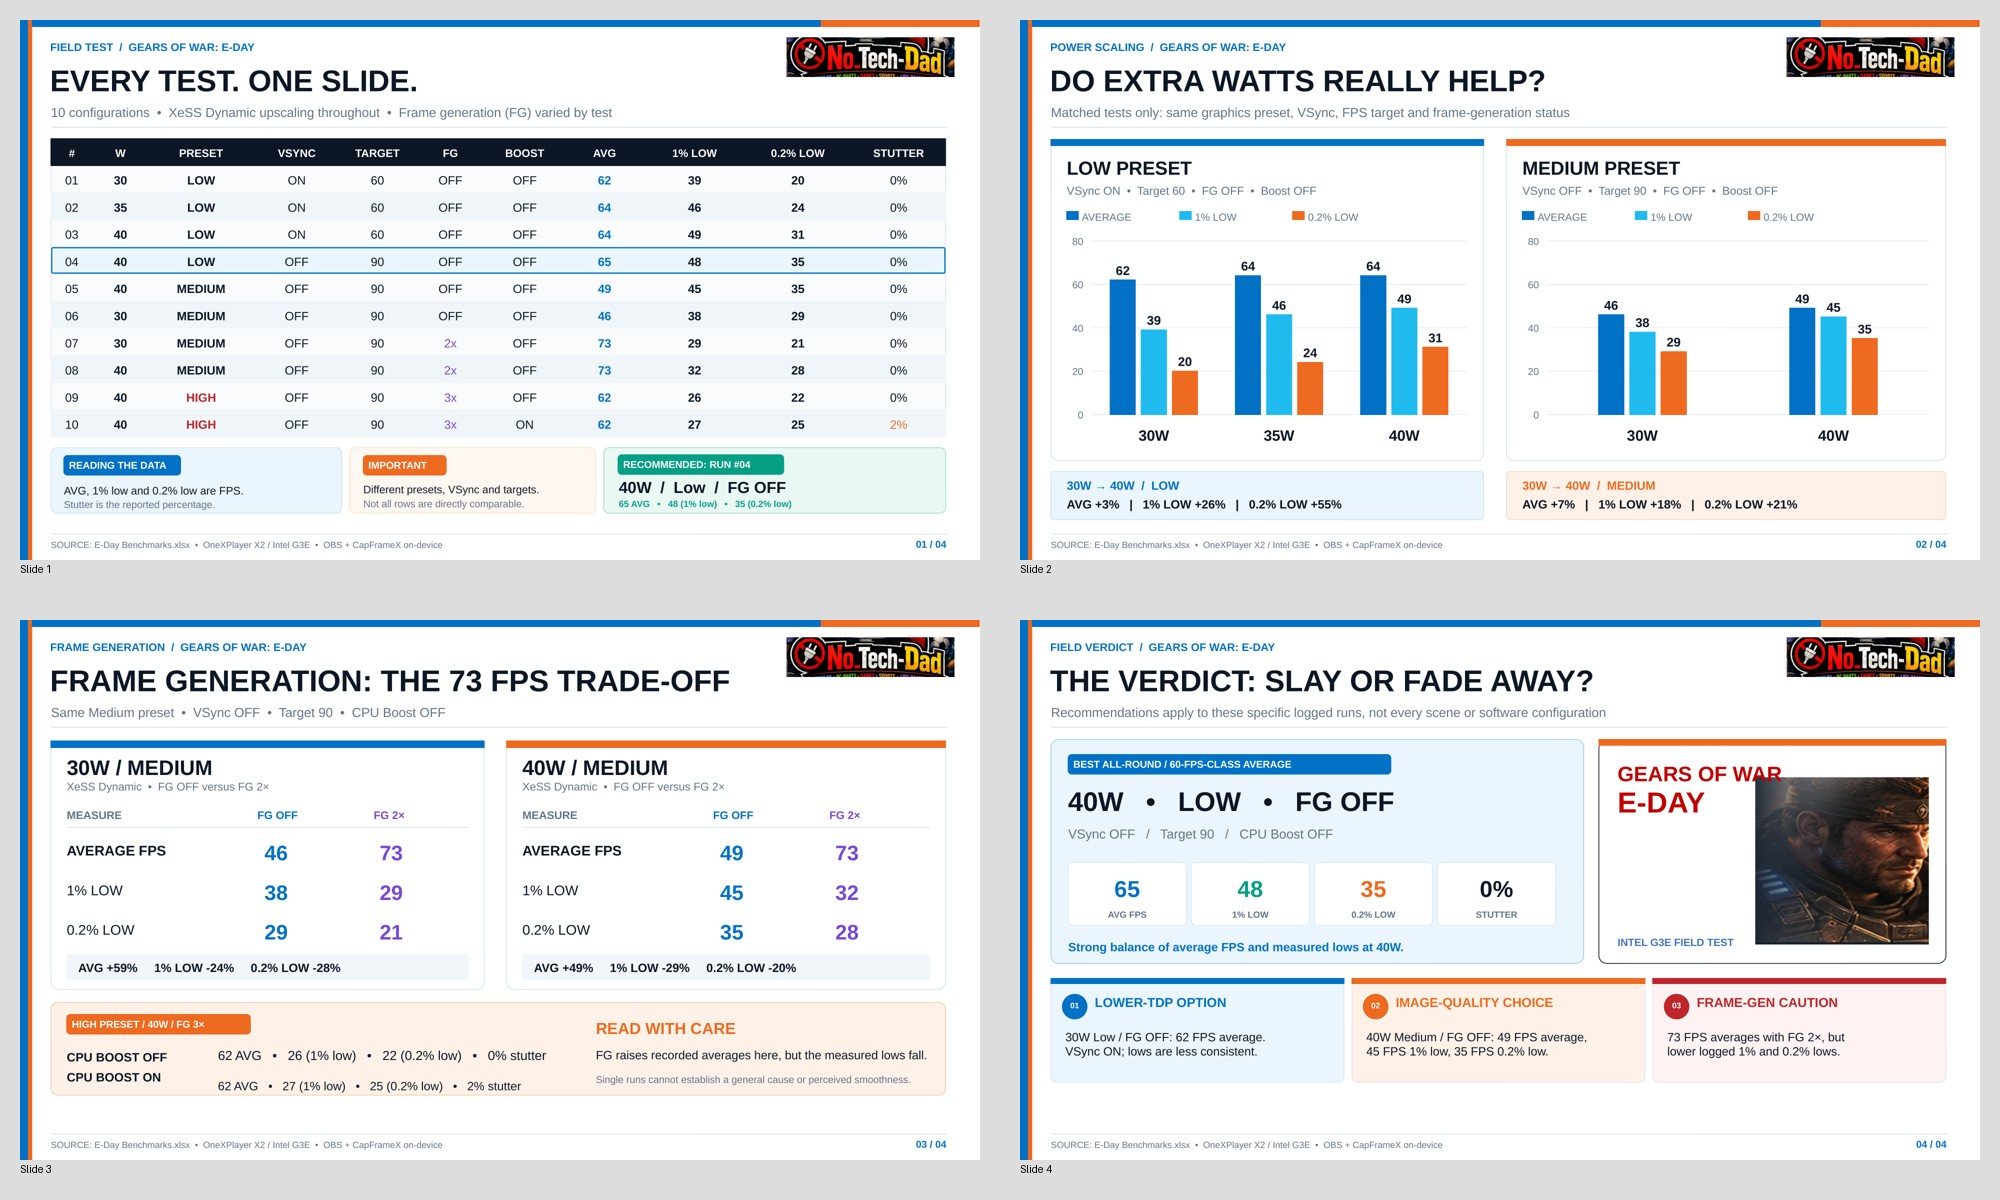
My pick is run 04: 40W, Low, frame generation off, for 65 fps average with a 48 fps 1% low and no reported stutter. At 30W, Low with VSync on still averaged 62 fps, but its lows were less consistent. Frame generation 2x lifts Medium to 73 fps average, but the logged 1% and 0.2% lows fall. Rows use different presets, VSync and targets, so not every pair is directly comparable, and these are single runs with recording running on the same handheld.

Four slides from the video: every test in one table, power scaling from 30W to 40W at Low and Medium, the frame-generation trade-off at 30W and 40W Medium, and the verdict, 40W Low with frame generation off.
The four summary slides from the video. Select to open full size.

Source: E-Day Benchmarks workbook · Watch the video ↗

X2 Mini Pro vs OneXFly Apex, Part 1: on the scale and on the road

Verified
X2 Mini Pro
OneXPlayer X2 Mini Pro, liquid-cooled edition, Ryzen AI Max+ 388 (8 cores), Radeon 8060S (40 CUs), 64 GB, 2 TB
Apex
OneXFly Apex, liquid-cooled edition, Ryzen AI Max+ 395 (16 cores), Radeon 8060S (40 CUs), 96 GB, 2 TB
Config check
Both checked on camera against the About screen and HWiNFO
Weights and sizes
Scale and calipers, median of three readings
Temps and noise
55W on both, on air, room at 22.5 °C. HWiNFO end-of-run readings and a UMIK-1 mic at 7 cm, medians of three runs
Unit
Mine, both
Date
Sep 2026

Weight and size

MeasureApexX2 Mini ProMini Pro vs Apex
Ready to play (body, controllers and battery)1,217.3 g1,288.0 g+70.7 g
Body with controllers, no battery814.6 g883.3 g+68.7 g
Battery pack403.2 g405.8 g+2.6 g
Charger433.1 g389.3 g−43.8 g
Device and charger, the minimum bag1,650.4 g1,677.3 g+26.9 g
Full kit with controller bridge, dongle and keyboardNo 3-in-1 extras1,947.5 g—
Width, landscape, controllers on290 mm310 mm+20 mm
Height122.7 mm135 mm+12.3 mm
Footprint355.8 cm²418.5 cm²+17.6%
Thickness, thinnest point, no battery23.9 mm24.6 mm+0.7 mm
Thickness, thickest point, no battery38.7 mm40.68 mm+2.0 mm
Thickness, battery attached46.28 mm47.86 mm+1.6 mm
Screen diagonal, lit area203.7 mm (8.02")224.5 mm (8.84")+20.8 mm
Lit screen area (Apex lit-height reading still under re-check)——+18.2%

Neither handheld weighs what its press figures say. The Mini Pro weighed 1,288 g ready to play, against a 1,090 g hands-on figure. The Apex body weighed 814.6 g against 699 g, but that figure predates the liquid-cooled edition.

Power on the road

TestApexX2 Mini Pro
Stock cable reach, brick to device125 cm175 cm
How to extend itXT60 extension on the DC sideAny standard PC power cord on the AC side
Anker Prime 160W: cold boot No No
Anker Prime 160W: hot swap No Yes
CUKTECH 300W: cold boot Yes Yes
CUKTECH 300W: hot swap Yes Yes
USB-C charger tests passed2 of 43 of 4

Cold boot means starting a fully powered-off handheld from that charger alone. Hot swap means pulling the stock adapter while the handheld is running and plugging in that charger, with no shutdown or brown-out.

Temperatures and noise at 55W on air

ReadingWorkloadApexX2 Mini ProMini Pro vs Apex
CPU max3DMark Steel Nomad74.5 °C62.0 °C−12.5 °C
CPU maxBlack Myth: Wukong benchmark, looped88.8 °C68.3 °C−20.5 °C
GPU max3DMark Steel Nomad61.8 °C61.7 °CEven
GPU maxBlack Myth: Wukong benchmark, looped65.6 °C77.0 °C+11.4 °C
Noise, load average3DMark Steel Nomad53.2 dBA54.3 dBA+1.1 dB
Noise, load max3DMark Steel Nomad62.4 dBA65.6 dBA+3.2 dB
Noise, load averageBlack Myth: Wukong benchmark, looped55.8 dBA56.9 dBA+1.1 dB
Noise, load maxBlack Myth: Wukong benchmark, looped60.9 dBA68.2 dBA+7.3 dB

At the same 55W, the Mini Pro keeps its CPU cooler but runs the same GPU hotter and louder in the Wukong loop. I don't know why yet, and I'm not claiming a cause before Part 2. Noise was measured at 7 cm with a room floor of 45.8 to 45.9 dBA. Idle readings were too close to that floor to count, so they're left out. Neither handheld reports a fan RPM, only a fan percentage in OneXConsole.

Why is it called the X2 Mini Pro?

X is the large-screen branch of OneXPlayer's 3-in-1 idea, which started with the OneXPlayer 2 in 2023: 8.4 inches, detachable controllers and a keyboard. The X1 took it to 10.95 inches in 2024. 2 is the line's second generation, in 2026. Mini is the 8.8-inch size class, first used by the X1 Mini in June 2024. Pro has twice meant a better chip in the same body: OneXPlayer 2 to 2 Pro (6800U to 7840U, 2023) and X1 to X1 Pro (8840U to HX 370, 2024). This time it marks the platform: the X2 Mini is Intel, and the X2 Mini Pro is AMD.

Three wrinkles. The Pro went on sale on Indiegogo on 15 June, before the X2 and X2 Mini were unveiled on 23 June, and shipped in September. It was teased as the "X2 Mini" with the Ryzen AI Max+ 395 in April and gained "Pro" for the global launch by 28 May, after which "X2 Mini" went to the Intel Arc G3 Extreme model. And it was announced with the 395 (16 cores) but shipped with the 388 (8 cores), with the same 40-CU GPU and the same TDP. The OneXPlayer 3 isn't an X3: it succeeds the OneXPlayer 2 and launched beside the X2.

WhenModelChip and notesLabel
Dec 2022OneXPlayer 2Ryzen 7 6800U, 8.4", detachable controllers and keyboard: the first 3-in-1V
Jun 2023OneXPlayer 2 ProRyzen 7 7840U, same body, better chipV
Jan 2024X1Core Ultra 5 125H or Core Ultra 7 155H, 10.95"Press
Jun 2024X1 (AMD)Ryzen 7 8840U, 10.95"V
Jun 2024X1 MiniRyzen 7 8840U, 8.8"V
Dec 2024X1 ProRyzen AI 9 HX 370, rebranded, presumably for the new chipV
Apr 2025X1 Pro EVA EditionCore Ultra 7 255H, special editionU
Jun 2025X1 MiniRyzen AI 9 HX 370, no "Pro" in the nameV
2025X1 AirCore Ultra 7 258V, a thinner branchV
Apr 2026"X2 Mini" teasedRyzen AI Max+ 395, 8.8" OLEDV
May 2026X1 Pro refreshRyzen AI 9 HX 470V
28 May 2026Renamed X2 Mini ProAnnounced ahead of Computex, still with the 395V
15 Jun 2026X2 Mini Pro on IndiegogoShips with the 388 insteadV
23 Jun 2026X2, X2 Mini, OneXPlayer 3, Apex AirSummer launch, Intel Arc G3 ExtremeV
Sep 2026X2 Mini Pro shipsRyzen AI Max+ 388, the unit tested hereV

V: confirmed against OneXPlayer, Notebookcheck, Liliputing, VideoCardz, Tom's Hardware, Retro Handhelds and TweakTown. Press: launch month as reported in the press. U: not independently verified.

Sources: X2 Mini Pro vs Apex physical workbook, v0.4, and the Part 1 opening deck, v0.7 · Watch the video ↗
Can the AYANEO Next 2 hold 85W plugged in?

Verified
Game
Crimson Desert, Medium, FSR 4.1, frame generation 2X
Before testing
AMD Adrenalin, chipset and firmware updated
Unit
Mine
Date
Sep 2026
ChargerCableHeld 85W?
Stock chargerStock cable Didn't hold
Stock charger240W USB-C (Thunderbolt 5) Held
Anker Prime 160W240W USB-C Held
CUKTECH 30 Ultra (300W)CUKTECH's own cable Held

On my unit the stock cable was the limit. These were short runs, and multi-hour runs on each pairing come next. The review's four did-not-finish results still stand, because that's how the unit behaved out of the box.

Watch the follow-up: AYANEO Next 2 85W Drops Solved ↗ · Video page →

G3E Family Feud: three Arc G3 Extreme handhelds

Buyer score

Verdict
  • OneXPlayer 388
  • OneXPlayer X278.5
  • OneXFly Apex Air73.5

My weighted buyer matrix from the video, in points. Higher is better. Bars start at zero.

Measured weight

Verified
  • OneXPlayer 3940 g
  • OneXPlayer X2controllers attached1,018 g
  • OneXFly Apex Airexternal battery pack attached1,046 g

Measured on my units. Scale runs from 0 to 1,100 g. The orange tick is the OneXPlayer 3's 953 g press figure.

Source: G3E Family Feud workbook, v1.24 · Watch the video ↗ · Video page →

Emulation

1 result

PS3 emulation on the OneXPlayer X2

Preliminary
Emulator
RPCS3 0.0.43; final runs on build 20366, PS3 firmware 4.93
Device
OneXPlayer X2, Intel Arc G3 Extreme, Arc B390 through Vulkan
Power
OneXConsole 40W, Turbo turned on during troubleshooting
Rendering
720p at 100% scale
Library
microSD
Unit
Mine
Date
21 Oct 2026

A pass means the game reached real gameplay, controls, audio and graphics were usable through an opening section, and a save loaded correctly after a restart. A menu, an intro or an FPS counter alone didn't count. Frame rates are readings I saw or reported during play, not CapFrameX averages.

GameFPS seenSave/loadResult
God of War Collection (God of War II HD shown)About 60Verified Passed
Persona 5Playable, no firm figureVerified Passed, after an intro freeze and a retry
Demon's SoulsAbout 30Verified Passed
Soulcalibur IVAbout 60Verified Passed
Asura's WrathAbout 30Verified Passed
Devil May Cry HD Collection (DMC 1, 2 and 3)About 60Verified Passed, all three
Resistance 3About 30Verified Passed, with a glitch while aiming through a scope that clears when you leave it
God of War III7–15 at first, then a steady 30 in combatVerified Passed after troubleshooting; long sessions untested
Gran Turismo 5Not recorded reliablyVerified, bought car kept Passed after startup and dealership freezes
Dante's InfernoAbout 60Not confirmed Gameplay passed, save/load still to check
Uncharted 3: Drake's Deception29.04 in one screenshot, taken at a freezeNot verified Unresolved: repeated freezes in the opening fight, also on v1.19
The Last of Us12–19 early, 27.71 in one later screenshotNot reliably verified Unresolved: freezes at startup, in play and while saving

The most useful discovery: check CPU Boost. OneXConsole showed 40W while Turbo, which OneXPlayer says turns on CPU Boost, was off. After turning Turbo on, God of War III held a steady 30 fps in combat and passed save/load, and Gran Turismo 5 finished an Arcade race, bought a car and still had it after a reload. Emulator builds and game settings also changed along the way, so this isn't a controlled measurement of Turbo on its own. It does mean the Turbo state belongs in the test record next to the power limit.

God of War III settings for the passing run: Turbo on at 40W; PPU and SPU decoders LLVM; SPU threads Auto; SPU block size Mega; XFloat Approximate; Vulkan at 720p, 100%; shader precision Ultra; Write Color Buffers on; patches Disable MLAA v3.0 and Disable SPU MLAA v1.5. Dropping to 50% resolution made it look worse without helping.

Uncharted 3 and The Last of Us both look far better with the in-game MLAA disabled and GPU Lighting enabled, and both reach gameplay, but they kept freezing. Uncharted 3's 29.04 fps screenshot was captured at the moment it froze, which is why an FPS counter on its own proves nothing.

These are first results from the sections I tested, not full playthroughs, official RPCS3 compatibility ratings or a guide to Android performance. The test procedure carries over to the AYN Odin 3; the Windows settings don't.

Sources: my RPCS3 test report, logs and screenshots · OneXConsole guide (Turbo) ↗ · RPCS3 wiki: God of War III ↗, The Last of Us ↗, Uncharted 3 ↗

eGPUs

1 result

OneXFly Apex vs an RTX 4060 eGPU setup

Verified
Apex
OneXFly Apex, Ryzen AI Max+ 395, Radeon 8060S, 96 GB unified memory, 120W on the Frost Bay liquid-cooling dock
RTX 4060 setup
Minisforum AI X1 Pro (Ryzen AI 9 HX 470, 32 GB), Minisforum DEG2 OCuLink dock, ASUS Dual RTX 4060 8 GB, desktop power supply
Gaming
2560×1440, same preset on both, frame generation off. Both rigs ran side by side at the same time
Drivers
Gaming runs: NVIDIA 610.88, AMD Adrenalin 26.7.1, frozen for the whole block
Power
The whole setup at the wall, ten samples per scored run, from the same run as the score
Runs
Three per test, medians quoted
Capture
External, on a separate PC. Synthetics, creator and AI tests ran in separate sessions per device, under matched conditions
Unit
Mine, both setups
Date
Jul to Aug 2026

Native 1440p, 10-game average

Verified
  • OneXFly Apex74.5
  • RTX 4060 setup70.7

Average fps across 10 games, Mortal Kombat 1 left out. Bars run from 0 to 80 fps.

Black Myth: Wukong, full ray tracing

Verified
  • OneXFly ApexFSR Quality23.9
  • RTX 4060 setupDLSS Quality40.5

Average fps, full RT Medium, super resolution 62 on both. Same 0 to 80 fps scale.

Native 1440p: no upscaling, no frame generation

GameApex avgApex 1% lowRTX avgRTX 1% lowApex vs RTX
Call of Duty: Black Ops 7 (lows are the game tool's 1st percentile)9830.08029.3+23%
Forza Horizon 695.983.182.970.3+16%
Cyberpunk 207792.259.781.258.1+14%
Assassin's Creed Shadows (lowest RT setting the game allows)53.045.349.340.8+8%
Red Dead Redemption 2114.571.0112.575.3+2%
Black Myth: Wukong46.540.846.039.0+1%
Shadow of the Tomb Raider103.484.5105.383.7−2%
Marvel Rivals55.042.157.640.1−5%
Assassin's Creed Black Flag Resynced45.835.548.838.2−6%
Avatar: Frontiers of Pandora (engine RT is always on)40.334.643.630.0−8%
10-game average74.570.7+5%
Mortal Kombat 1 (capped at 60, left out of the average)57.720.859.946.6−4%

Mortal Kombat 1 shows why averages aren't enough. Both machines average about 60 fps against the game's cap, but the RTX 4060 holds a 46.6 fps 1% low while the Apex drops to 20.8, with a 14.1 fps 0.2% low. The RTX setup holds the cap, and the Apex stutters.

Ray tracing and upscaling at 1440p: DLSS on the RTX, FSR on the Apex, frame generation off

GameSettingsApex avgRTX avgApex vs RTX
Call of Duty: Black Ops 7RT on, Quality55.443.0+29%
Forza Horizon 6RT High, Quality54.846.6+18%
Assassin's Creed ShadowsRT High, Quality52.246.8+12%
Avatar: Frontiers of PandoraEngine RT, Quality70.066.6+5%
Assassin's Creed Black Flag ResyncedRT Standard, Quality58.858.8Even
Cyberpunk 2077Same RT preset, Quality38.844.5−13%
Black Myth: WukongFull RT Medium, super resolution 6223.940.5−41%
Red Dead Redemption 2 (only FSR 2 on the Apex)No RT, Quality98.388.4+11%
Marvel RivalsNo RT, FSR 4 / DLSS Performance96.0101.5−5%
Shadow of the Tomb RaiderNo RT, highest preset, XeSS / DLSS Quality95.6118.0−19%
Mortal Kombat 1 (capped at 60)RT on, FSR 3 / DLSS Quality57.459.9−4%

The pattern: with light or engine-level ray tracing the Apex keeps up or leads. With path-tracing-class RT, the RTX 4060 pulls away. In Wukong at matched settings it's 70% faster. The upscalers differ by platform, so these rows compare each machine at its best, not like for like.

Synthetic, creator and AI tests

TestApexRTX 4060 setupApex vs RTX
3DMark Fire Strike Ultra7,0995,913+20%
3DMark Time Spy11,36610,692+6%
3DMark Time Spy Extreme5,4135,163+5%
3DMark Solar Bay50,05948,876+2%
3DMark Steel Nomad Light10,53210,641−1%
3DMark Port Royal5,7196,134−7%
3DMark Steel Nomad2,0652,329−11%
3DMark Speed Way2,0642,704−24%
FurMark 2, 1440p7,6394,555+68%
Geekbench 6 GPU, Vulkan103,000107,868−5%
Geekbench 6 GPU, OpenCL101,087105,307−4%
Geekbench 6 CPU, single-core2,9312,924Even
Geekbench 6 CPU, multi-core20,04214,491+38%
Cinebench CPU, single-core114119−4%
Cinebench CPU, multi-core1,8521,216+52%
Cinebench 2024 GPUDidn't finish8,592—
Blender Monster (HIP / OptiX)674.71,042.3−35%
Blender Junkshop (HIP / OptiX)547.2838.1−35%
Blender Classroom (HIP / OptiX)487.2683.5−29%
PugetBench for DaVinci Resolve, Standard overall58,25655,588+5%
PugetBench, GPU Effects42.647.7−11%
Procyon AI Computer Vision 2.01,3413,000−55%
Procyon AI Image Generation, Stable Diffusion 1.58,95317,308−48%
Procyon AI Text Generation, Phi-3.5-mini1,0591,901−44%
Procyon AI Text Generation, Mistral 7B1,0181,931−47%
Procyon AI Text Generation, Llama 3.1 8B9101,092−17%
Procyon AI Text Generation, Llama 2 13B1,0231576.5×

Cinebench GPU: Cinebench 2024 won't run on the Radeon 8060S, and Cinebench 2026 crashed in AMD's HIP runtime three times out of three, so the Apex has no score. DaVinci Resolve: Studio 21 on both. The Apex crashed the whole system twice before three clean runs, then won the overall score. Llama 2 13B: the model doesn't fit in the RTX 4060's 8 GB of VRAM, and the Apex's 96 GB of unified memory has no such wall.

Noise at 50 cm: the Apex on the Frost Bay dock measured 61.0 dBA idle and 69.2 dBA under sustained load. The RTX setup measured 64.0 dBA under sustained load, and at idle it was at or below 48.7 dBA, too close to the room's 46.7 dBA floor to measure. The handheld and dock are the louder system at every state.

Source: Apex vs RTX 4060 benchmark workbook, v12.38 · Watch the video ↗

mini PC results go up here once their workbooks are locked.